Writing a Scientific Procedure
Now it's time to write your procedure, so that other scientists can try the experiment exactly the same way you did. A scientific procedure is similar to a recipe; it's a step-by-step guide to completing your project. At this point, your procedure will be a list of steps you plan to do. Later, you may need to revise your procedure so it accurate reflects what you actually did. You'll want to include every single step. Write in list format so it is easy for others to follow.
All good scientists repeat their experiments multiple times. It's easy for something to go wrong in any one experiment. The more you repeat your test, the more reliable your results will be. You must test your results at least 3-5 times. For example, if you are testing which brand of popcorn pops best, you might compare three different brands. For each brand, you should pop three to five bags of popcorn. If you are testing which fertilizer helps plants grow the most, you'll want to test each brand on at least three to five plants.
| Procedure Worksheets |
STOP! You MUST have submitted ALL of the official forms before you begin testing.
Experimenting & Collecting Data

Good news! You're now ready to begin the most exciting stage of the science fair project: EXPERIMENTING! Once your teacher has approved your mission plan (which includes your typed procedure, materials list, and variables), you'll be allowed to start experimenting.
Follow your procedure. You might discover that your procedure needs to be modified so that it works better. That's fine, just as long as you remember to change your procedure so it matches what you actually do. As you conduct your experiment, record your observations and data (measurements or results) in your log book. Remember, your log book should be in your own handwriting. Date any entries in your log book, and record your data regularly.
Don't forget: You must repeat your test a minimum of 3-5 times!
| Data Collection Worksheet |
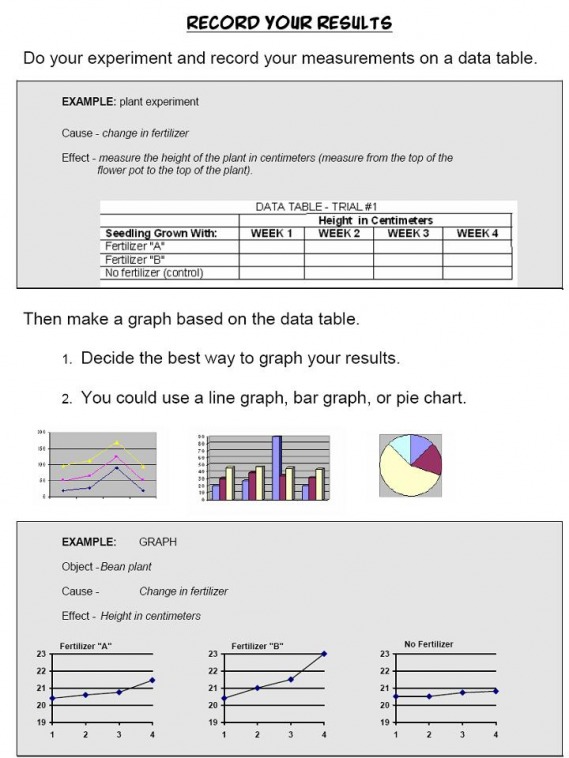
Data Representation

Once you complete your experiment and gather you data, you need to represent the results in a way that will be easy for others to interpret. Graphs and tables are among the best methods for showing results. You can use any spreadsheet program (Excel, Google Spreadsheet, etc.) to create your graphs and tables. Make sure to label the axis of your graphs and give them clear titles.
Conclusion & Interpretation

Gathering data isn't enough; you need to consider the results and explain what happened. In your conclusion, clearly state what happened and give reasons to explain why the results occurred. You may need to do some more research to determine the cause. Does the data support your hypothesis? Don't worry if it proves your hypothesis wrong. You just need to explain why your hypothesis was wrong.
Now, explain why your results are important for others. What does your project tell us about our daily lives or the world? Can you results be used to help us make better, smarter decisions?
| Conclusion and Interpretation Worksheet |
Reflection
All scientists reflect on their work. Take time to write about your project. What went well? What would you change if you could? What would you like to know now? Your reflection paragraph will let others know that your took your project seriously and learned to think like a scientist.
| Reflection Worksheet |
Abstract
An abstract is a summary of your project. It is important because it allows others to quickly read what your project is about and what your discovered. Your abstract should not be longer than 250 words. In your abstract, you’ll want to summarize your:
*question and purpose
*hypothesis
*procedure (remember to be brief, but clear)
*results and conclusion
| Abstract Worksheet |
